Building the Foundation with SmartArt
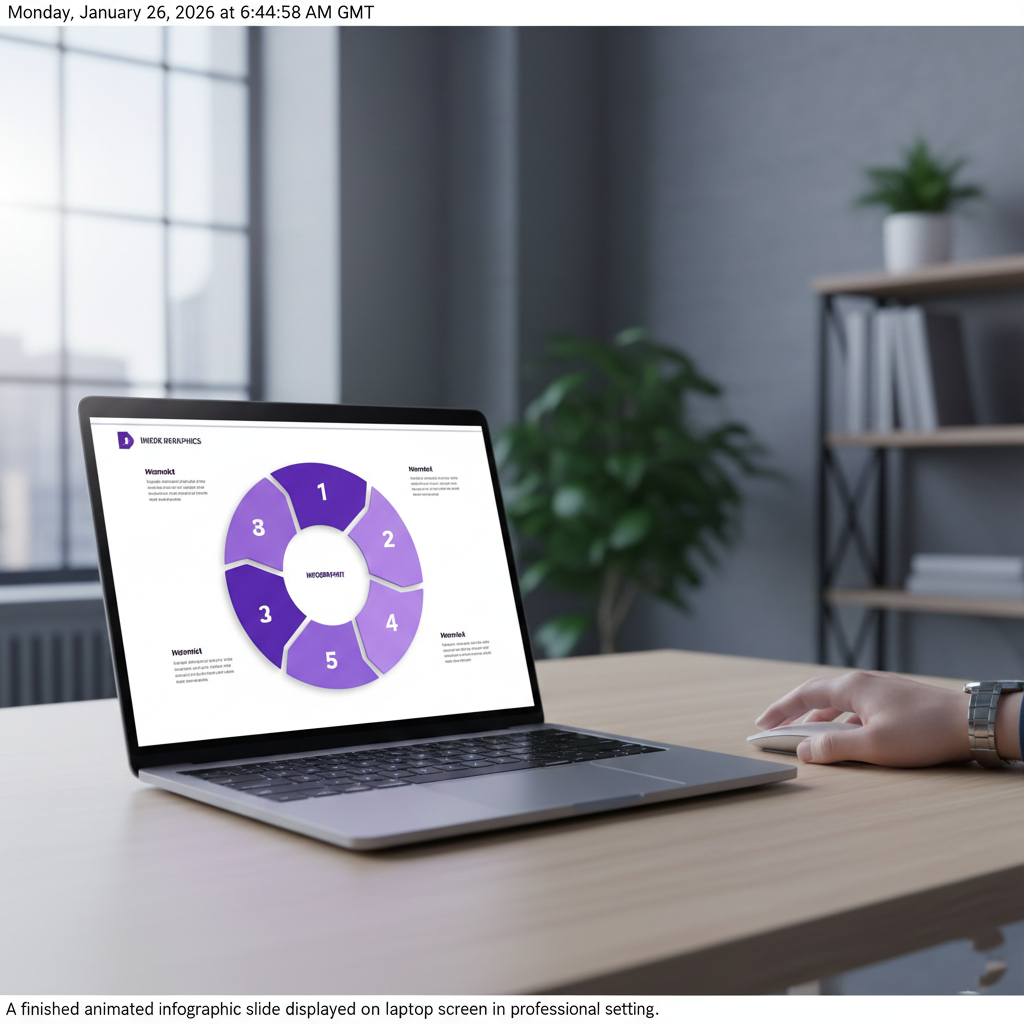
Creating custom shapes doesn’t require external design software. You can start by leveraging PowerPoint’s built-in SmartArt. A “Basic Venn” relationship graphic provides a perfect starting point for a multi-part circular infographic.
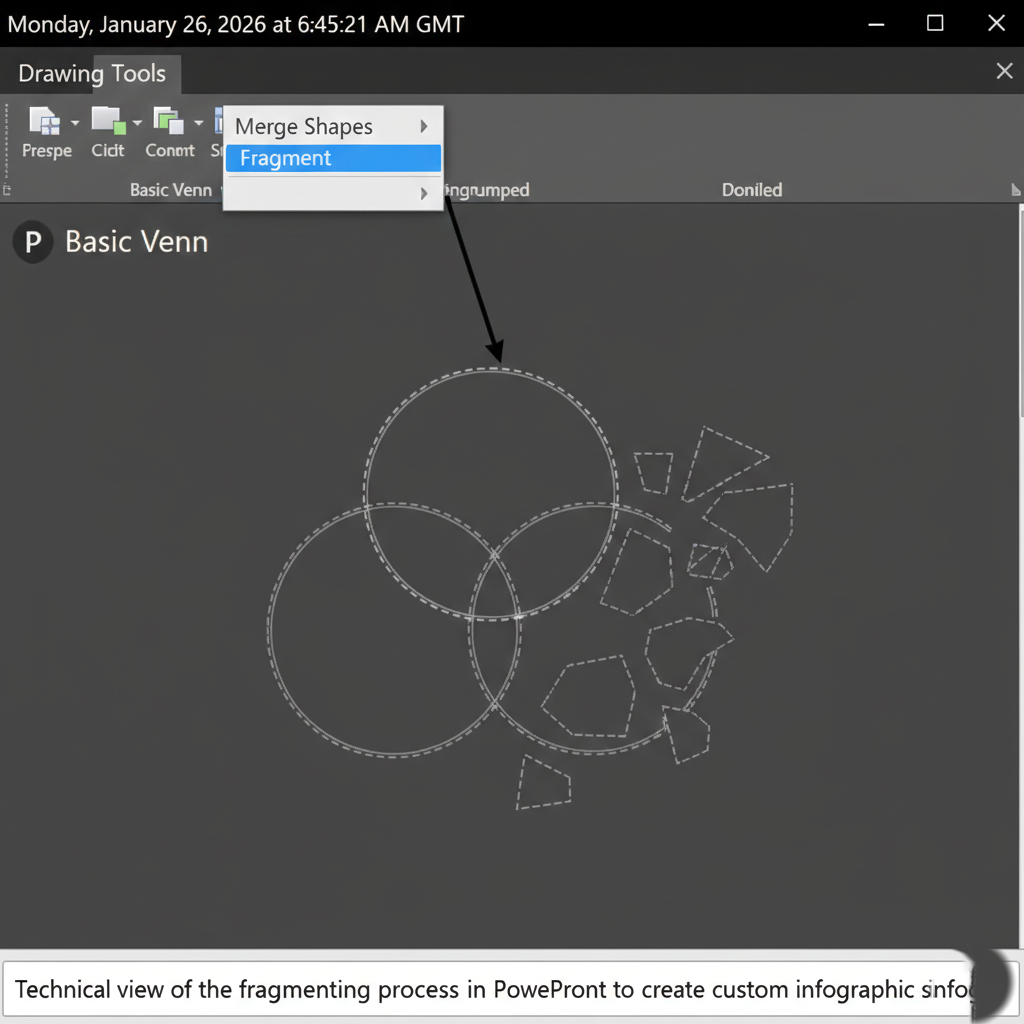
The secret to customization lies in “breaking” the SmartArt. By ungrouping the graphic multiple times and using the Fragment tool within the Merge Shapes menu, you can isolate individual components. This allows you to delete unwanted central pieces and combine remaining segments using the Union tool to create unique, moon-like shapes that fit together perfectly.
Styling with Color and Depth
A professional look relies heavily on a cohesive color palette. For a modern aesthetic, consider a monochromatic theme—such as varying shades of purple—moving from dark to light across the infographic sections.
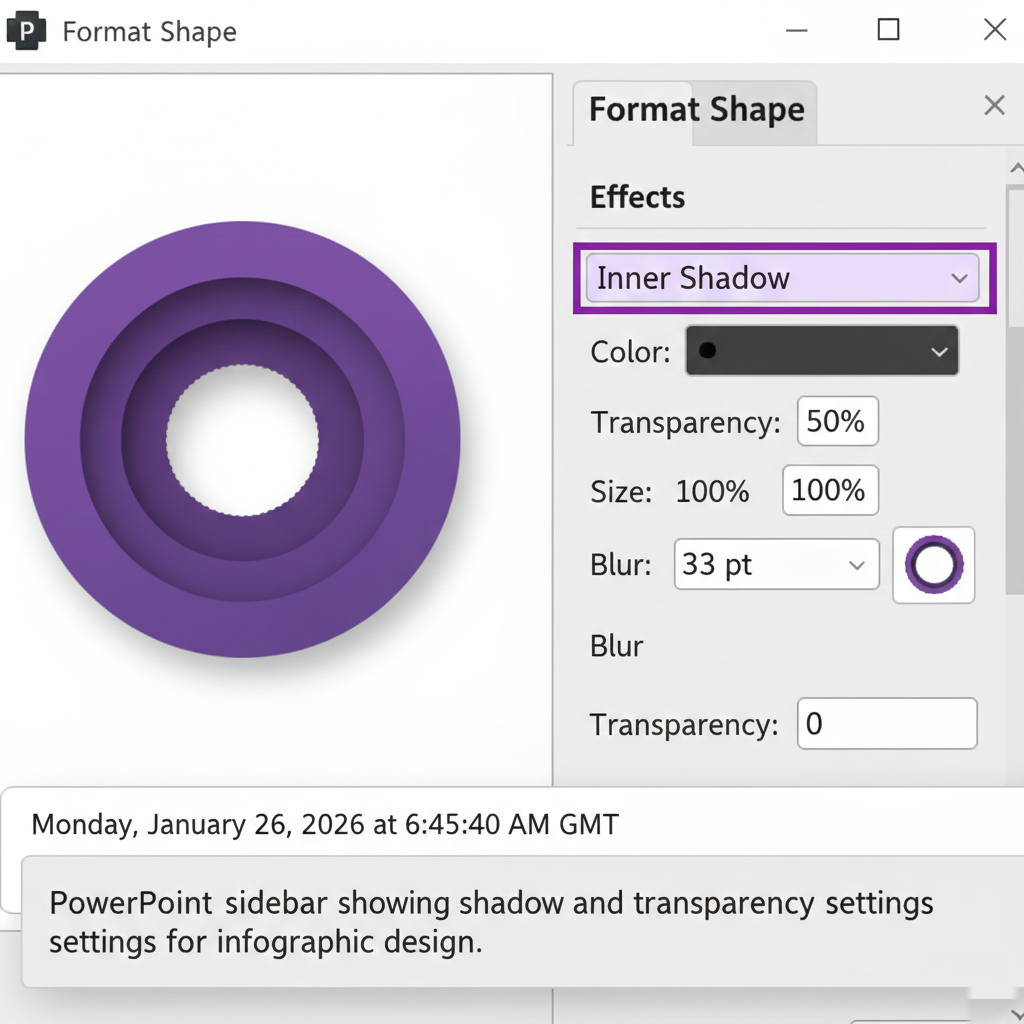
To add depth, move beyond flat colors. Applying an Inner Shadow with a high blur setting (around 33pt) creates a recessed, professional appearance. When adding text, use a clean, modern font like Montserrat. Ensure your numbering is bold and high-contrast—black text on lighter sections and white text on darker ones—to maintain readability.
Adding Context and Hierarchy
Once the visual skeleton is ready, it’s time to add your content. Align text boxes with each corresponding infographic section. Use a clear hierarchy: a bold title (size 18) followed by concise, smaller body text for the details.
For a balanced look, group your text boxes with their respective shapes. This ensures that when you move into the animation phase, the labels and descriptions remain tethered to the correct visual data point.
Mastering the Morph Transition
The hallmark of a high-end presentation is smooth animation. Instead of using complex entrance effects, use the Morph transition.
- Duplicate your finished slide. 2. On the first slide (the “Start” state), move the infographic shapes and text boxes outside the visible slide area.
- Rotate the shapes and scatter them with varying delays—placing some further away than others.
- Apply the Morph transition to the second slide (the “End” state).
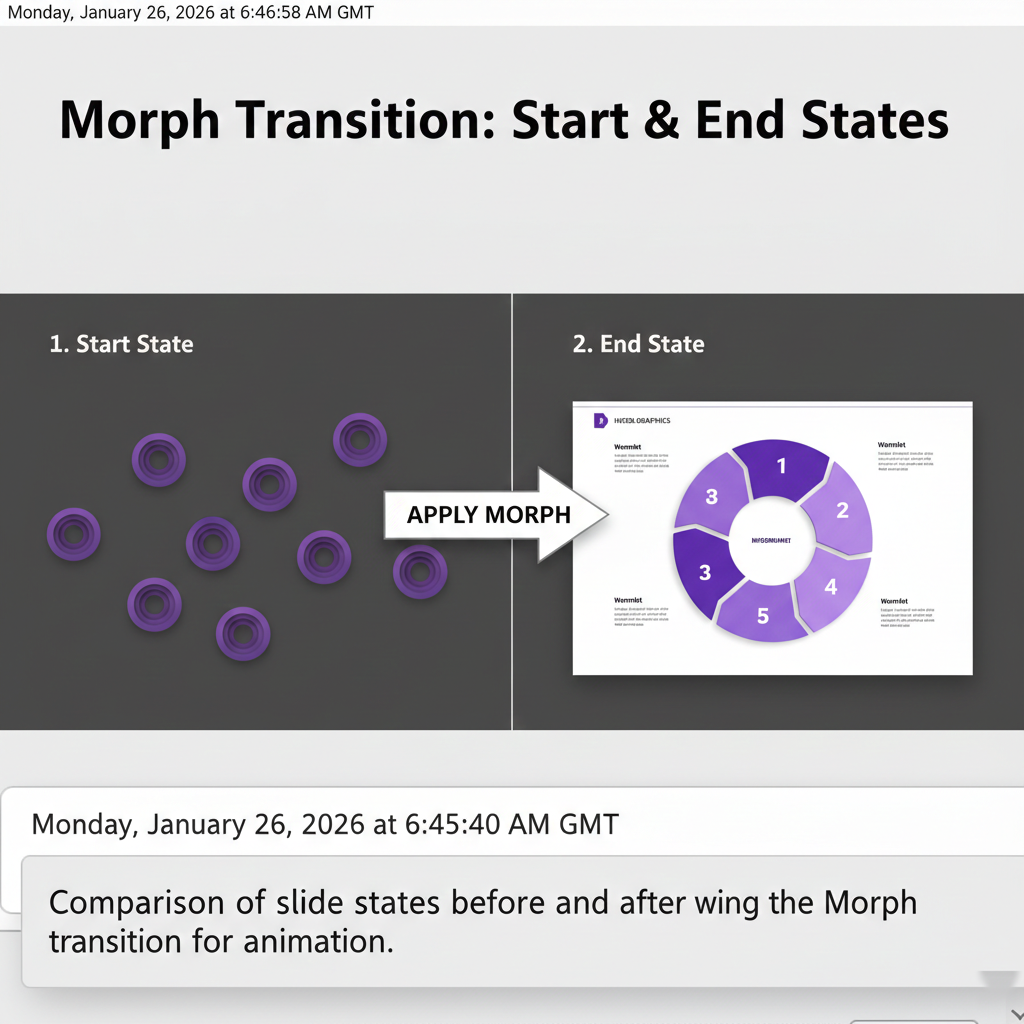
When you present, PowerPoint will automatically calculate the path for each object, making them “fly in” and assemble themselves into the final infographic. This creates a cinematic effect that immediately elevates the perceived quality of your work.


Leave a comment